


We work with some of the most influential companies in the information ecosystem. Meet our partners.
Get great business results by advertising on high-quality news.
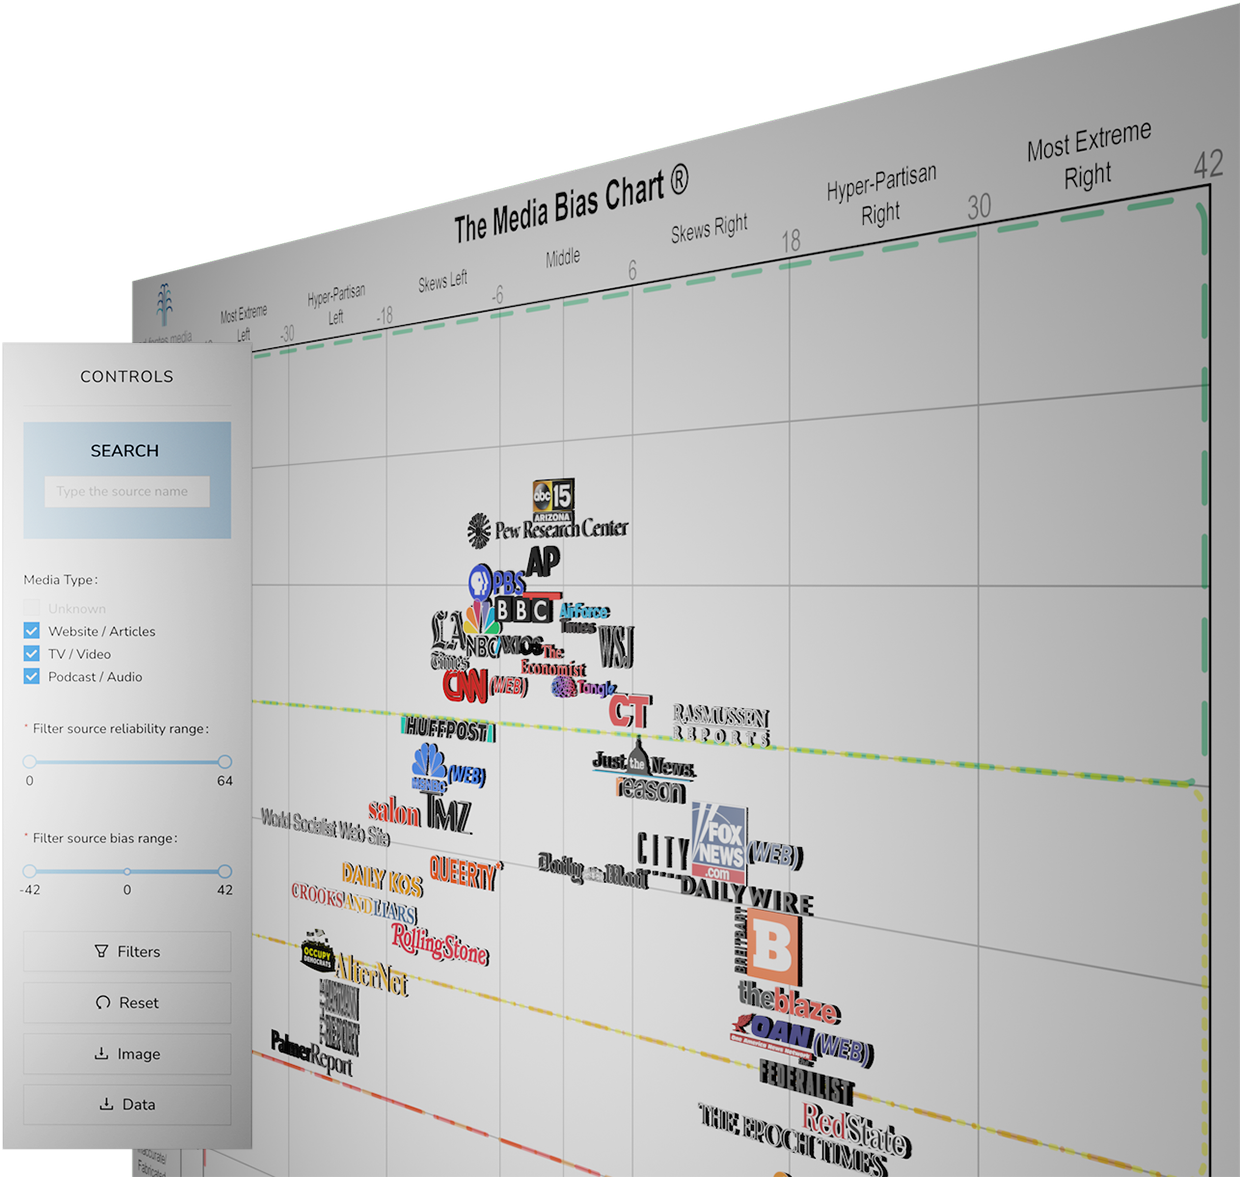
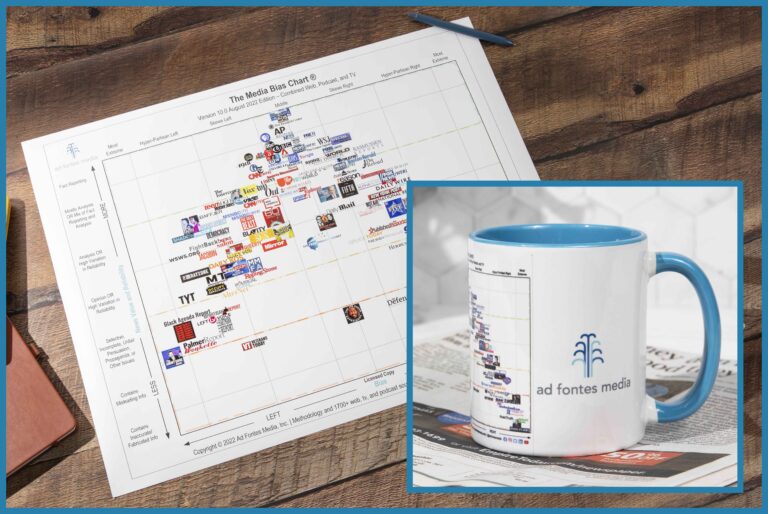
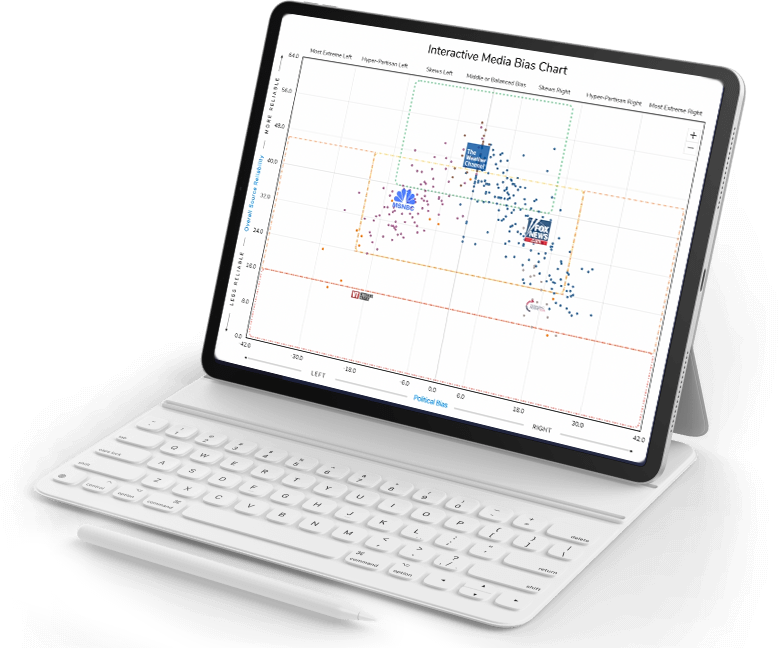
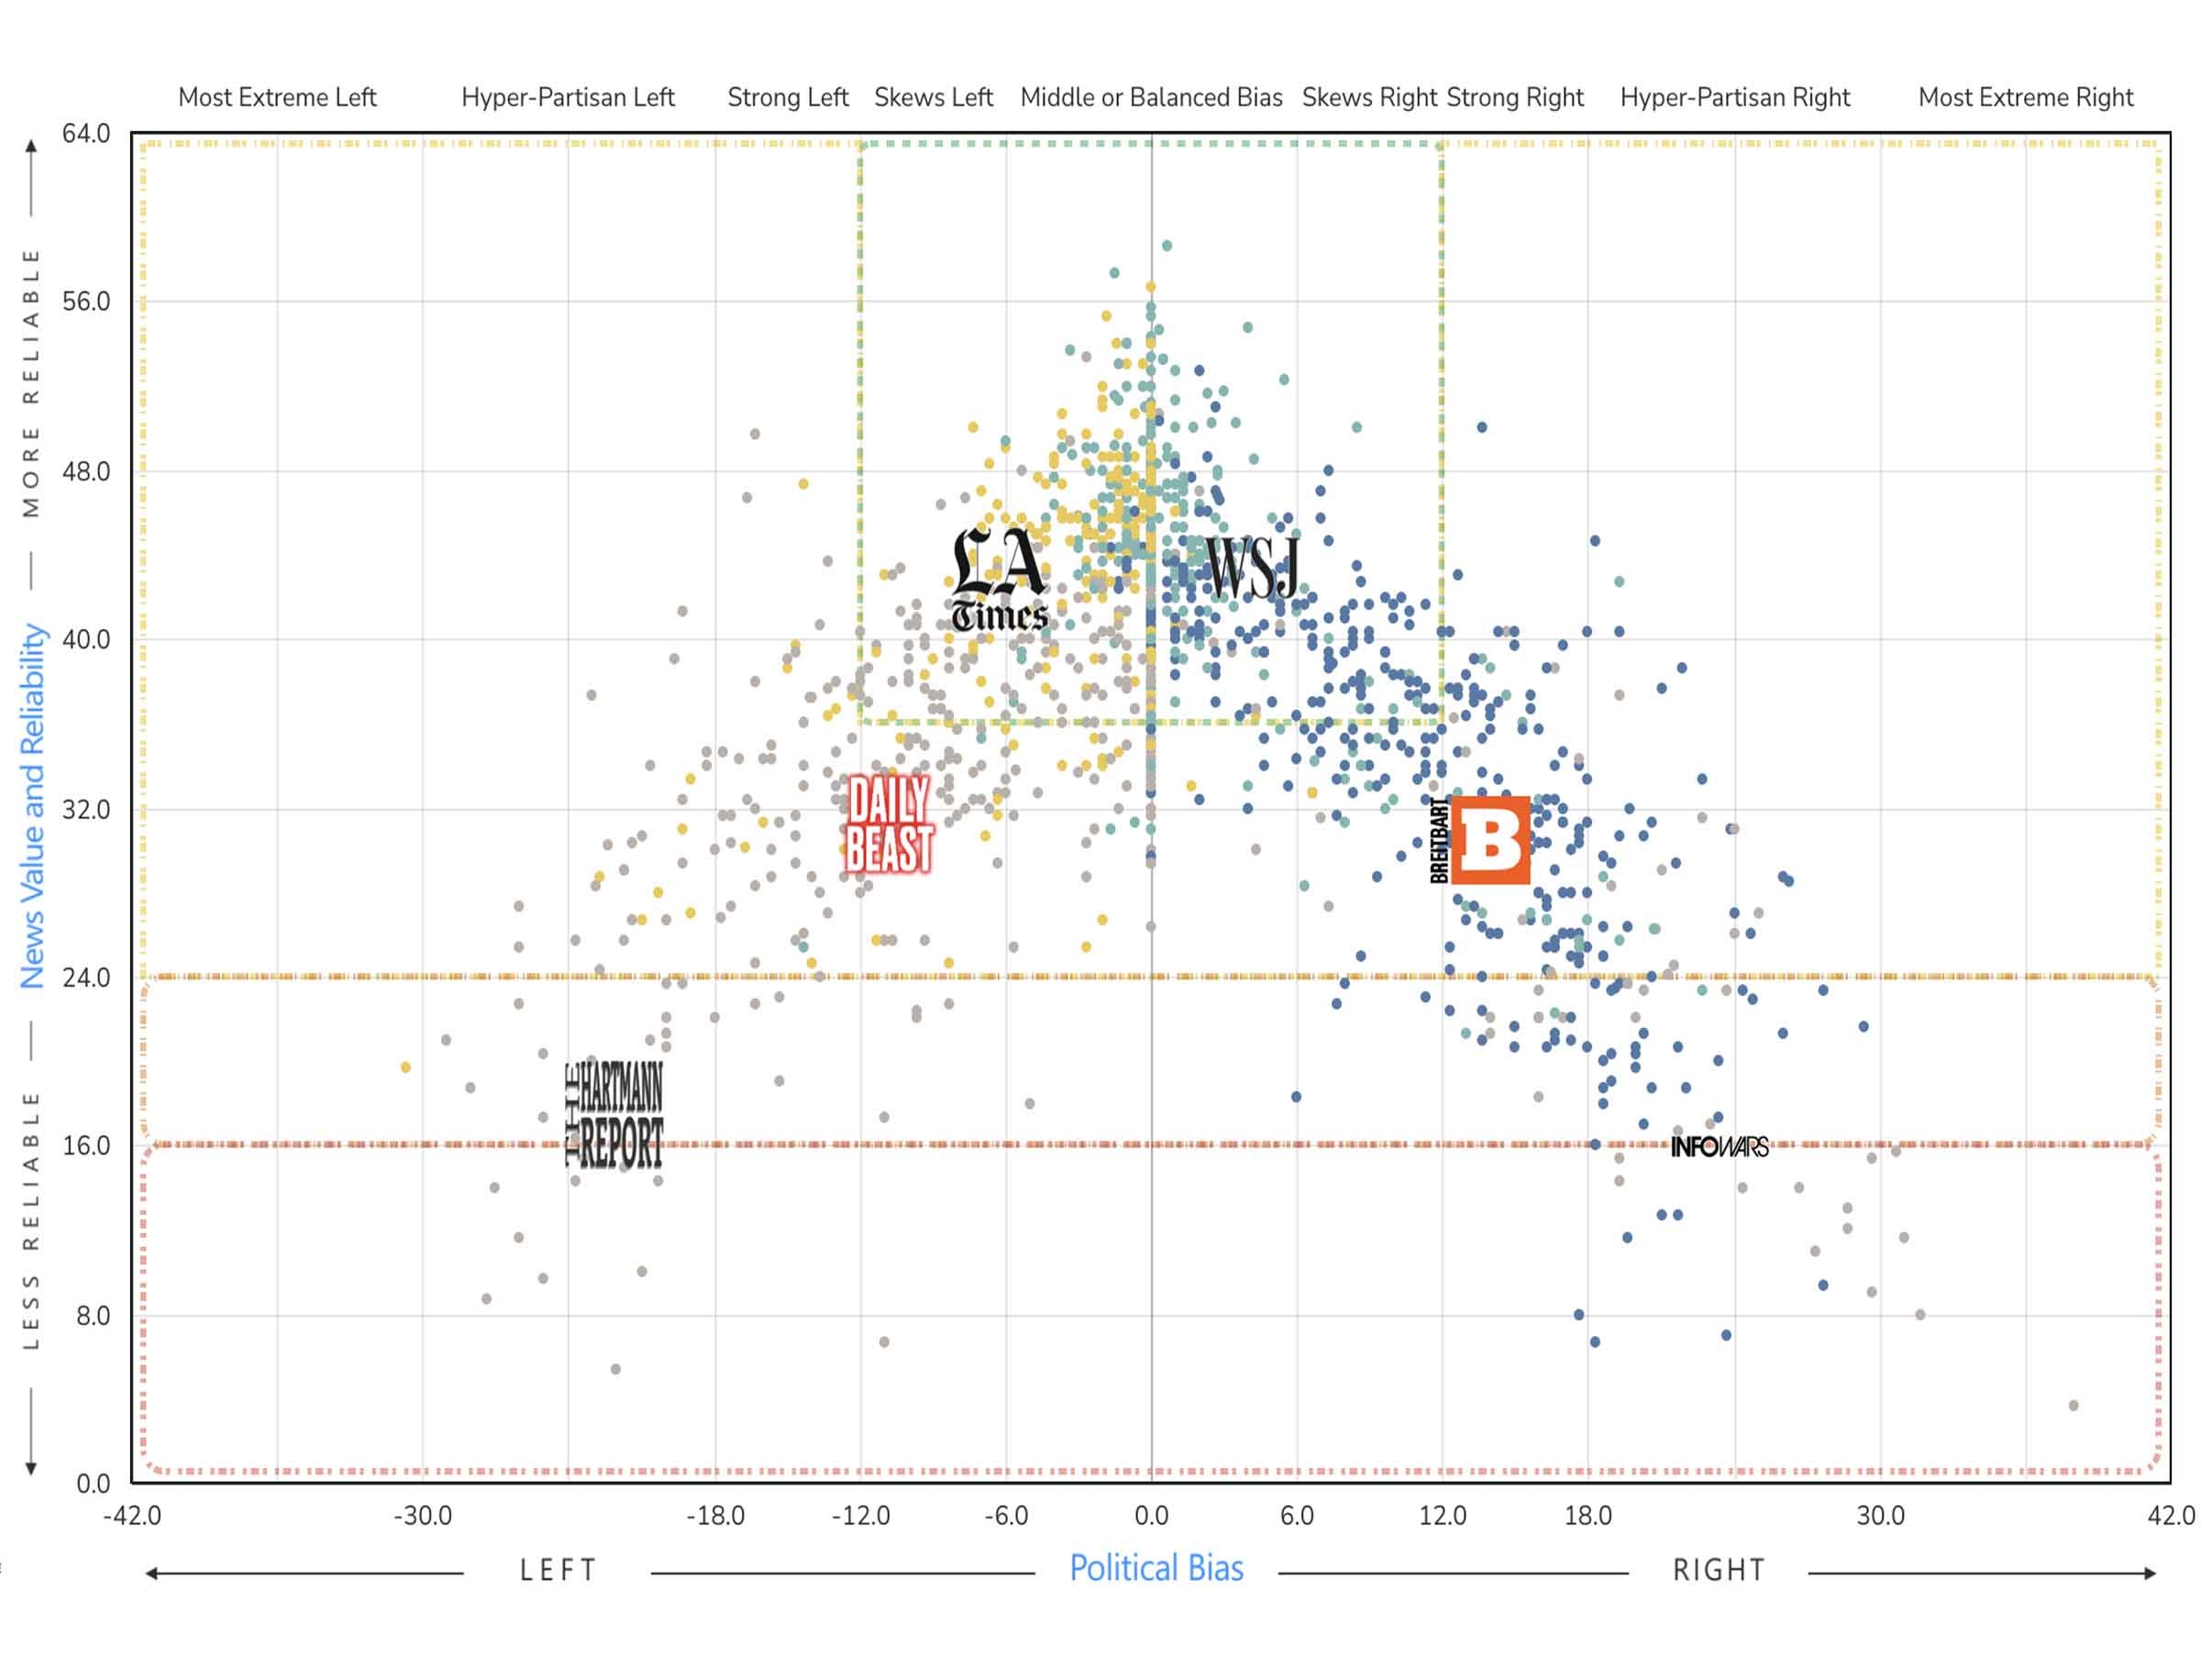
Know the reliability and bias of the news and information sources you consume. Help your friends and family improve their media literacy.
Teach news literacy effectively. Access data to inform your research.
Showcase your high reliability rating from Ad Fontes Media to improve monetization.
Find the best information sources. Invest in responsible journalism. Make the news media industry healthier in the long run.
Want to make sure you always see the
latest versions of the Media Bias Chart?
Join the Ad Fontes Media email list!
You’ll get information about all of our work for
news consumers, educators and enterprises.