Columbia Journalism Review Bias and Reliability
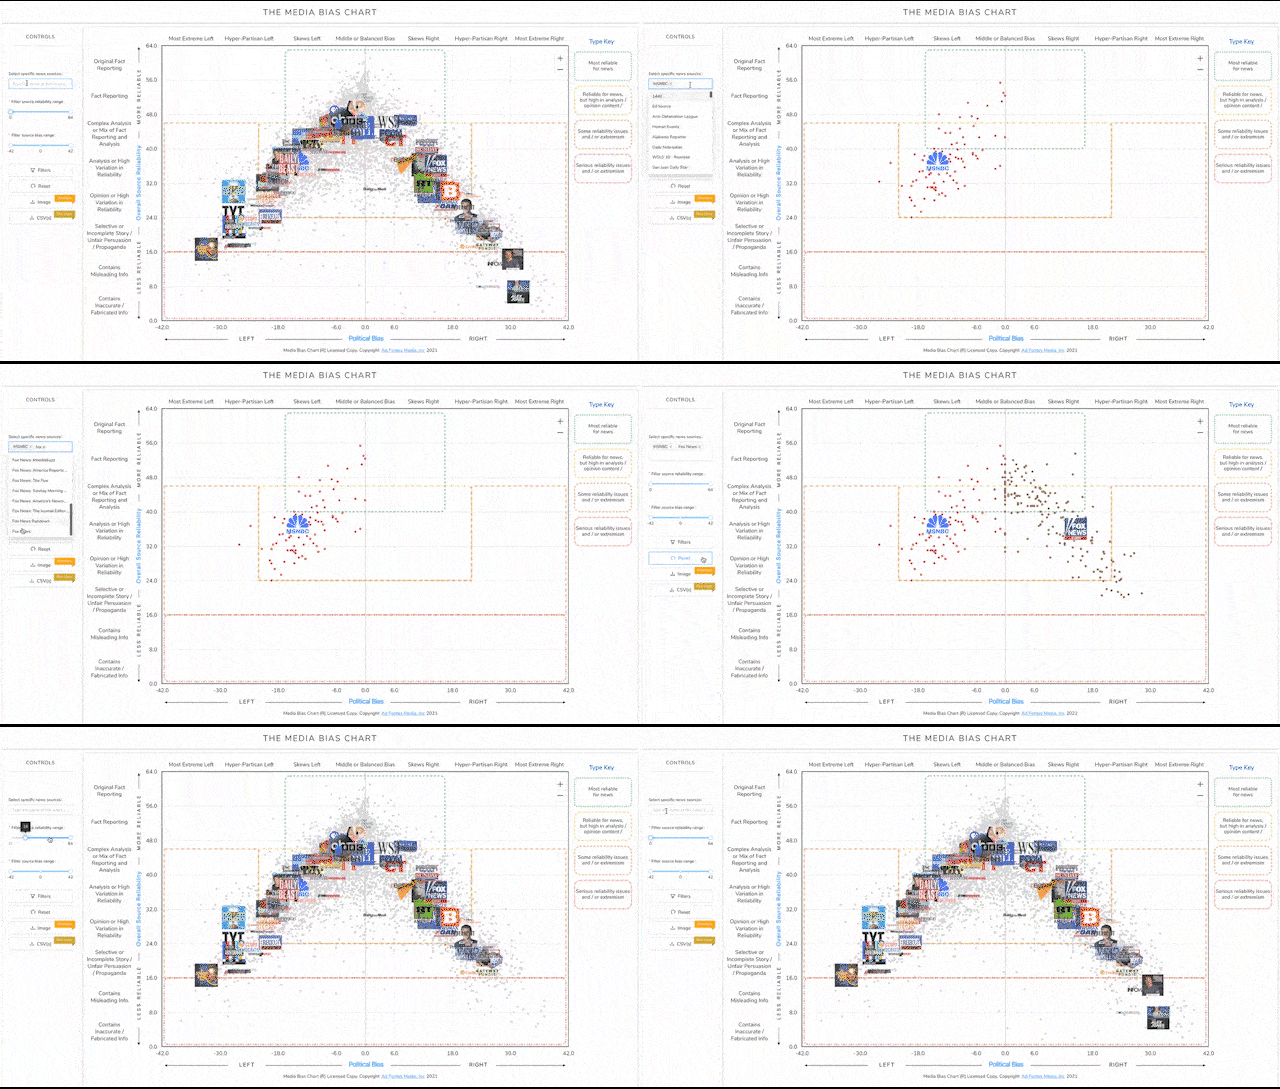
Compare the scores of Columbia Journalism Review to other sources on our free Interactive Media Bias Chart®️. Click Here!

Bias: Skews Left
Reliability: Reliable, Analysis/Fact Reporting
Overall Score
The following are the overall bias and reliability scores for Columbia Journalism Review according to our Ad Fontes Media ratings methodology.
Bias: -6.26
Reliability: 43.33
Bias scores for articles and shows are on a scale of -42 to +42, with higher negative scores being more left, higher positive scores being more right, and scores closer to zero being minimally biased, equally balanced, or exhibiting a centrist bias.
Reliability scores for articles and shows are on a scale of 0-64. Scores above 36 are generally good; scores below 24 are generally problematic. Scores between 24-36 indicate a range of possibilities, with some sources falling there because they are heavy in opinion and/or analysis, and some because they have a high variation in reliability between content pieces.
Panels of analysts from Ad Fontes Media regularly review representative sample content to rate it for reliability and bias. Each panel of analysts comprises one left-leaning, one right-leaning, and one center-leaning analyst.
The team considers a variety of factors when rating content. To determine the bias score of a piece of content, we consider its language, its political position, and how it compares to other reporting from other sources on the same topic. We add each of these scores to the chart on a weighted scale, with the average of those creating the source’s overall bias score.
To determine its reliability score, we consider the content’s veracity, expression, its title/headline, and graphics. We add each of these scores to the chart on a weighted scale, with the average of those creating the source’s overall reliability score.
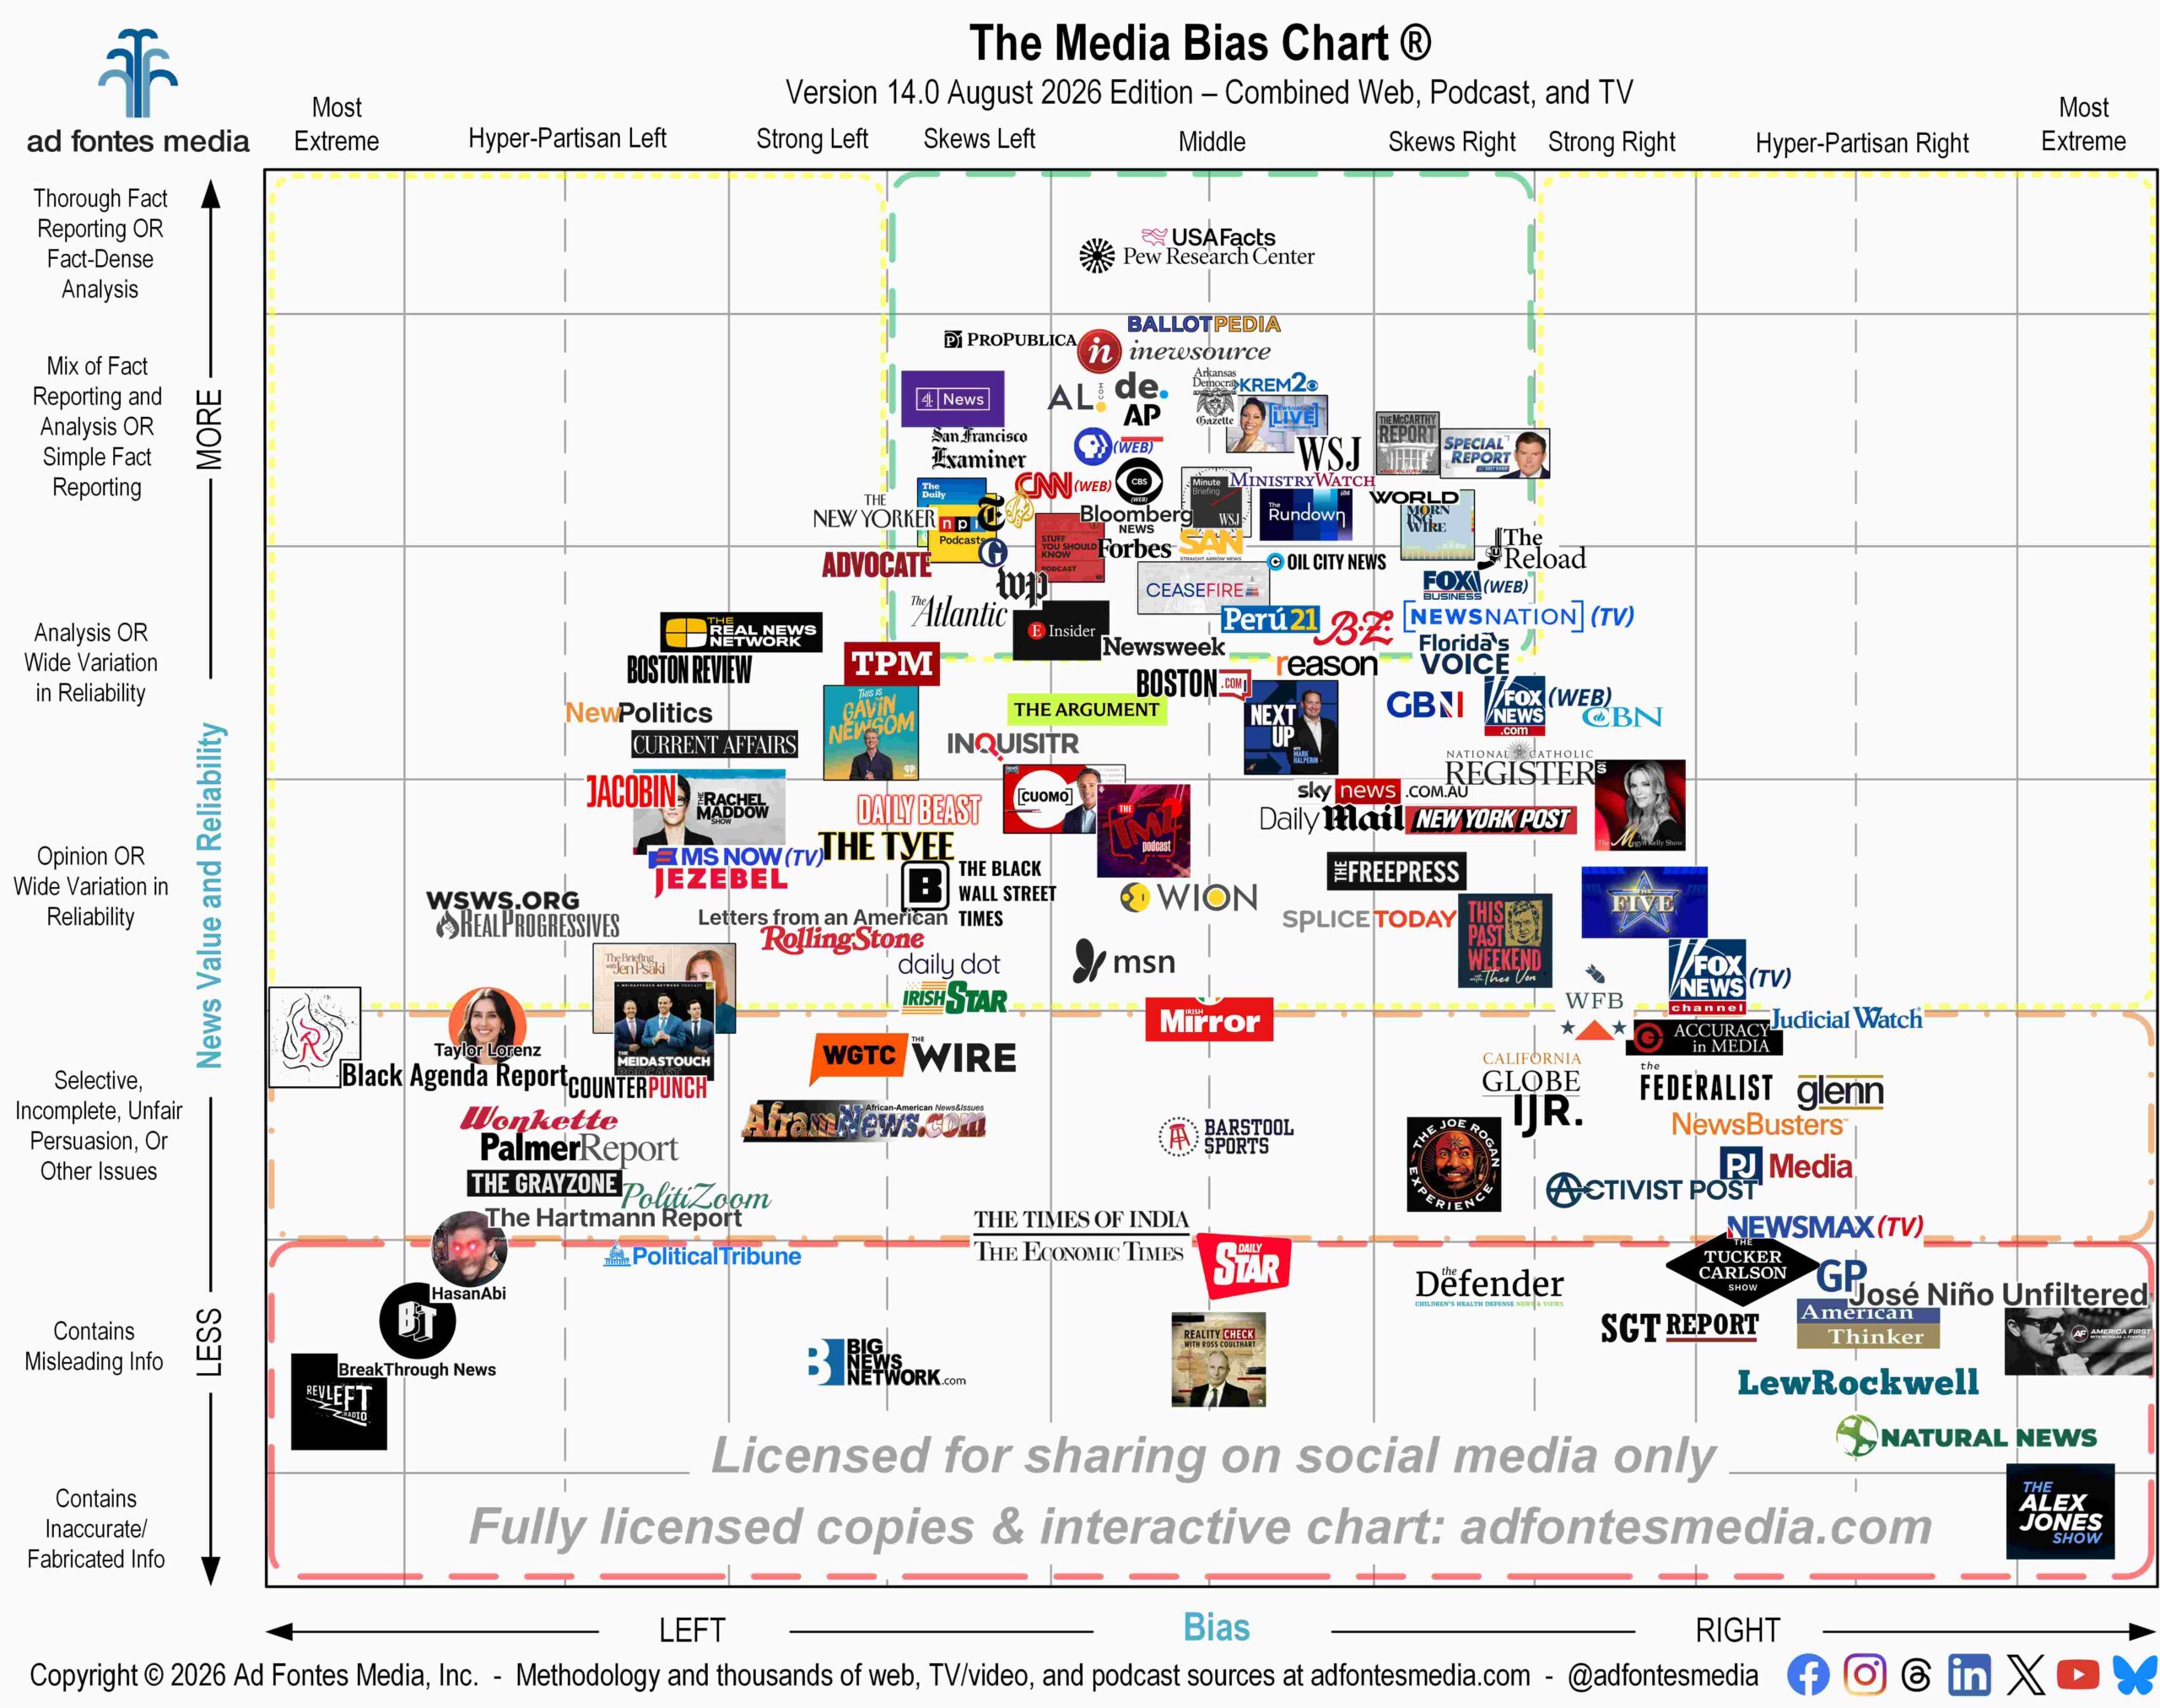
The bias rating, demonstrated on the horizontal axis of the Media Bias Chart®️, ranges from most extreme left to middle to most extreme right. The reliability rating, demonstrated on the chart’s vertical axis, rates sources on a scale from original fact reporting to analysis, opinion, selective/incomplete, misleading, and inaccurate/fabricated information.
Individual Content Sample Scores
These are the most recent content samples that Ad Fontes Media analysts have rated for this source.