
What’s new on Media Bias Chart 8.0
Since the release of Media Bias Chart 7.0 in January 2021, we have rated hundreds more news sources using our content analysis methodology.
These include hundreds of TV and Podcast sources, because after all, people get their news and news-like information from all kinds of media formats. Just like with web sources, you can find TV and audio news content from all across the news landscape–top to bottom and left to right.
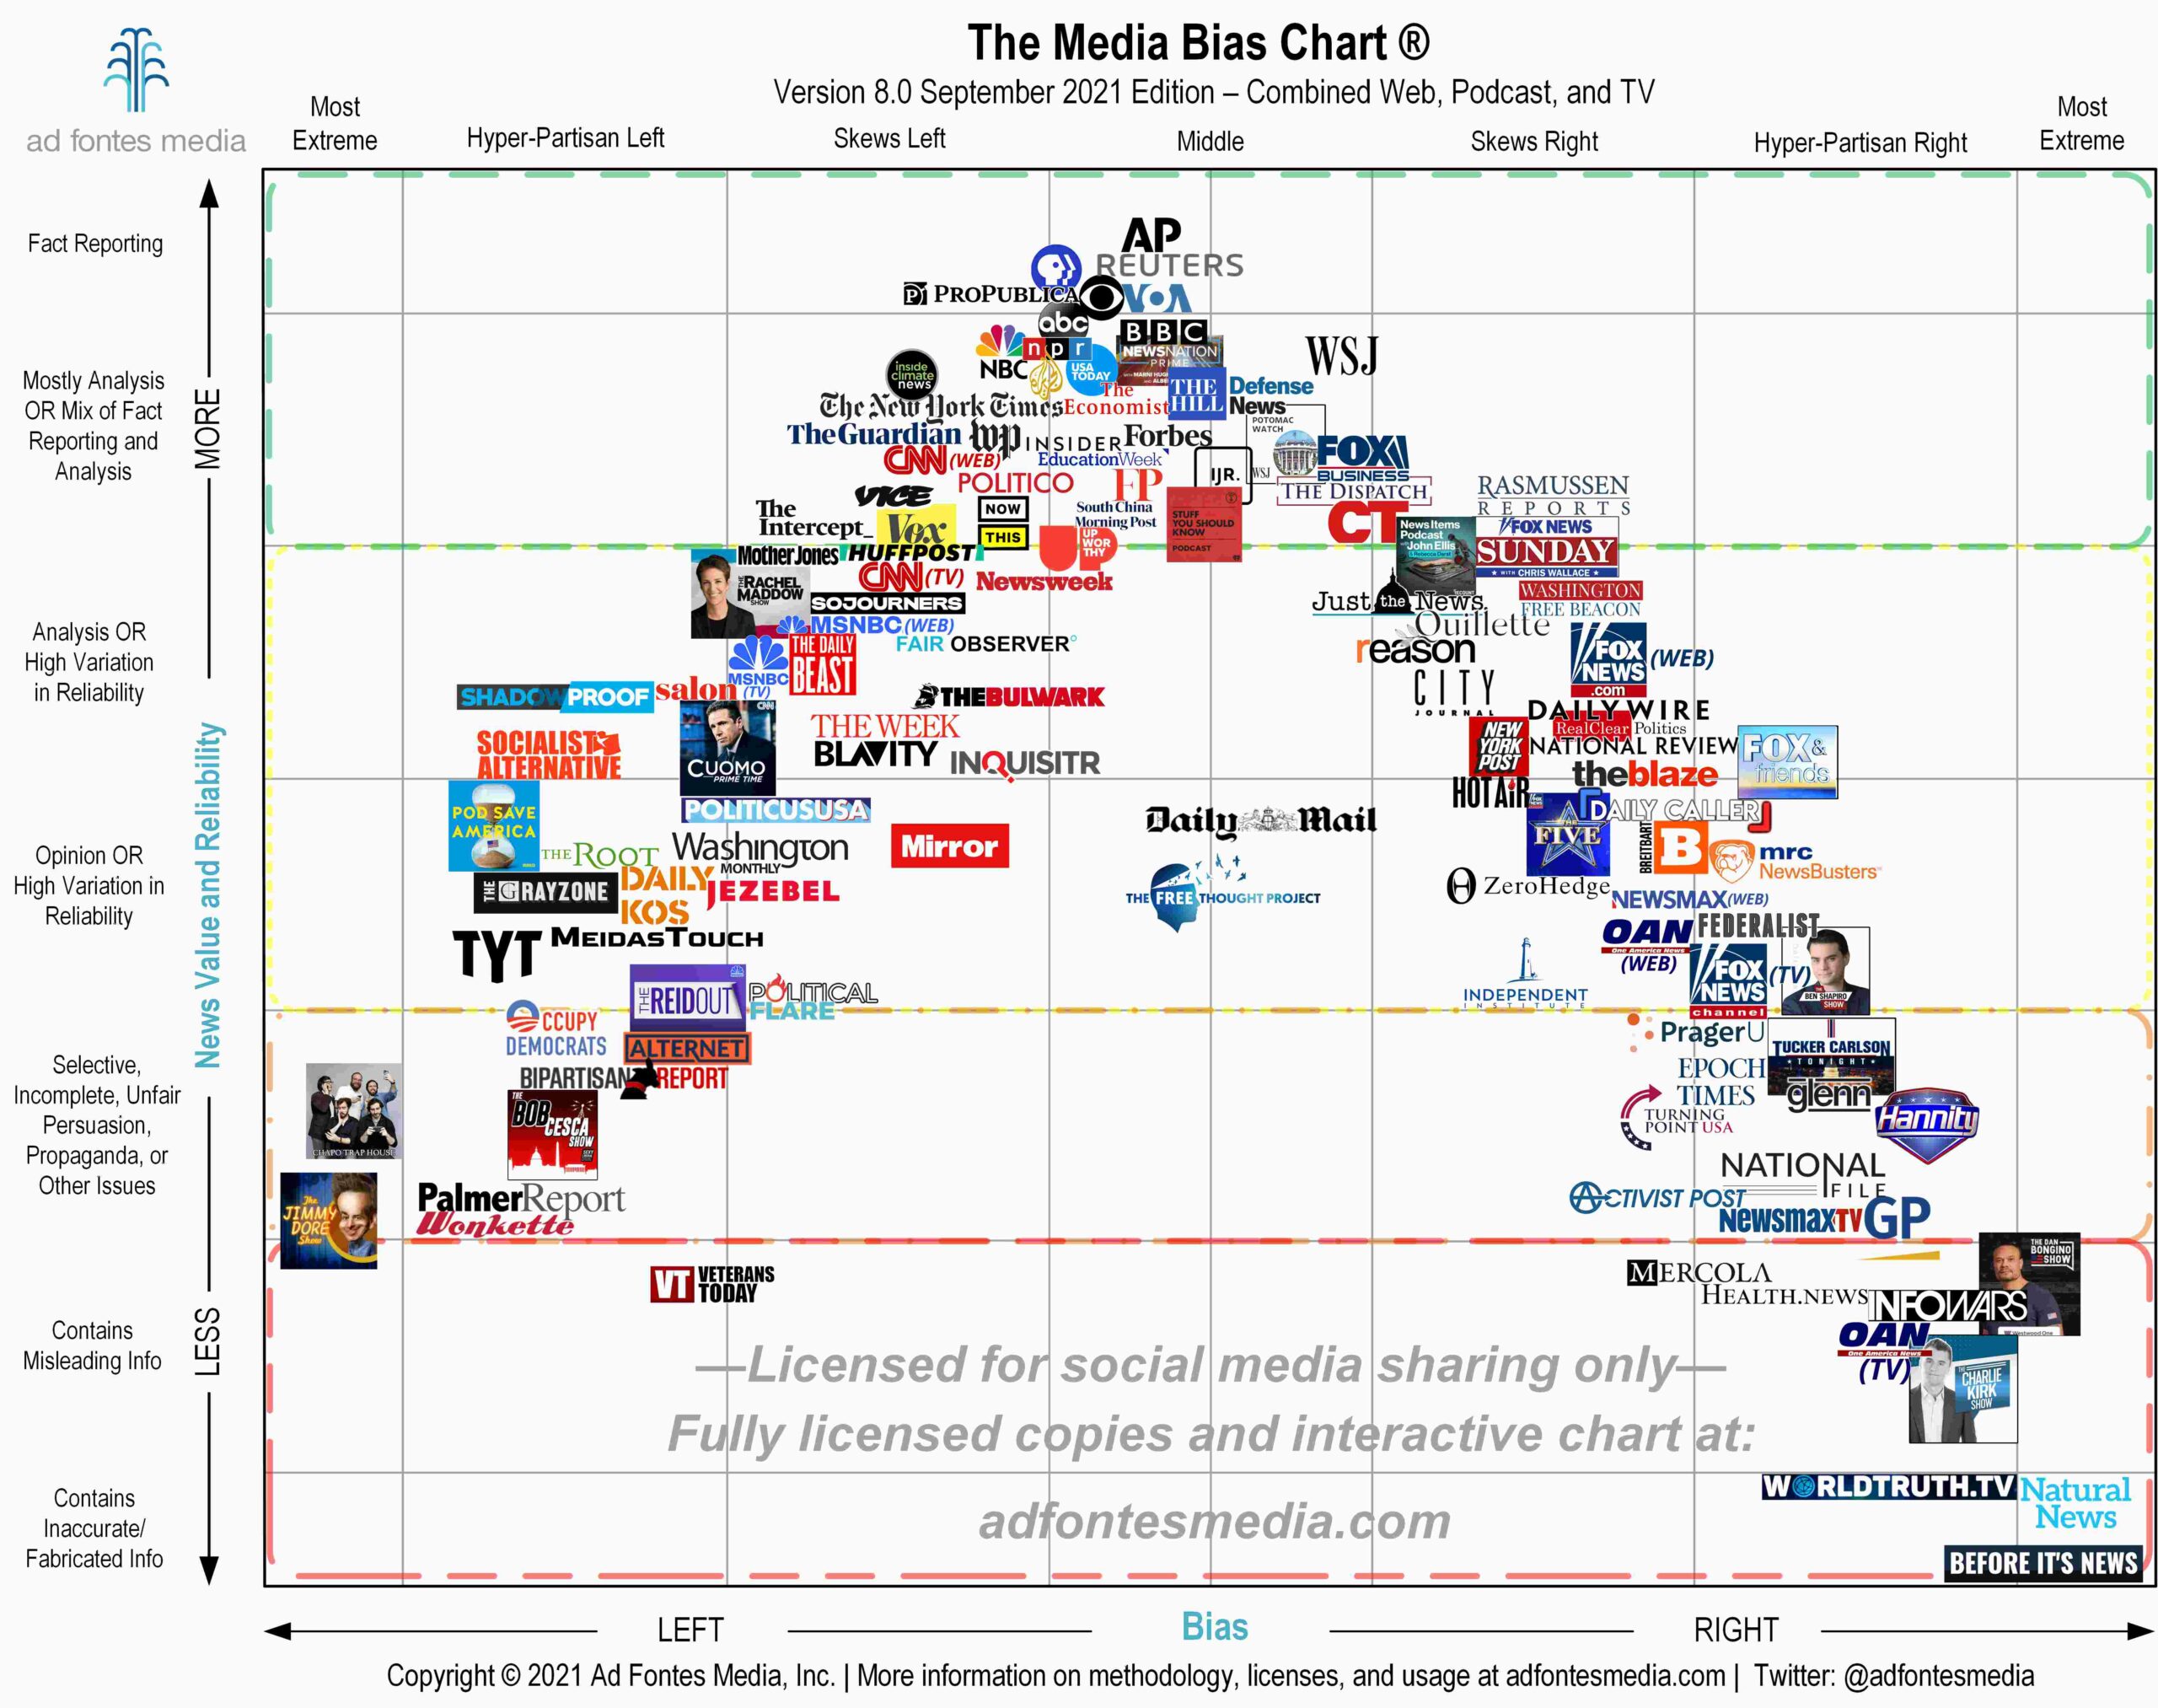
The main difference from prior versions is that Media Bias Chart 8.0 now includes popular Web, TV, and Podcast sources on the same chart for the first time ever! We will still produce web-only, TV-only, and podcast-only editions each month, but this new flagship version shows many popular shows across all mediums.
Explore this version and you’ll notice a few interesting things that you might want to dig deeper into on our online Interactive Media Bias Chart
- We’ve separated out ratings for the web and TV versions of several cable networks, such as Fox, CNN, MSNBC, Newsmax, and OAN. Notably, in each case, TV content for each publisher has lower reliability and higher bias scores than its corresponding web content.
- We have included a handful of popular cable news shows from MSNBC, CNN, and Fox. There are big differences between reliability and bias scores on shows within the same network! It’s not enough to say “MSNBC and CNN are left” and “Fox is right.” It is far more illuminating to explore the spread of shows across the network–particularly the differences between morning shows and prime time shows.
- Several new entries with low reliability and high bias scores are from the podcast world. Combined with the trend showing cable TV shows have lower reliability and higher bias scores than their web counterparts, it appears that video and audio formats seem to lend themselves to content designed to rile up one side by demonizing the other or outright misinforming them.
- Sources in the middle reliability range can land there for very different reasons. These are the sections labeled “Analysis or High Variation in Reliability” and “Opinion or High Variation in Reliability.” As the categories suggest, some sources in there are just all analysis or all opinion content. Other sources contain a mix of straightforward fact-reporting with occasional problematic or misleading content, which is why we call them “high variation in reliability.”
As a result, it is not straightforward to make direct comparisons between sources in these analysis/opinion/high variation categories. They all vary a lot in their content. The best way to see exactly how they differ is by going to the Interactive MBC and looking at the spread of article ratings for each source. As you can see here, three sources with similar reliability scores–The Week (articles represented by pink dots), Daily Mail (articles represented with green dots), and National Review (articles represented by blue dots) have very different content profiles.
