Skip to content
  • About
    • About Us
    • Our Team
    • Press
    • News
    • About Us
    • Our Team
    • Press
    • News
  • Media Bias Chart®
    • Interactive Media Bias Chart
    • Static Chart
    • Methodology
    • Source Pages
    • Interactive Chart
    • Static Chart
    • Methodology
    • Source Pages
  • Products & Services
    • Advertisers
    • Publishers
    • Educators
    • Individuals
    • Other Businesses
    • Speaking Engagements
    • Advertisers
    • Publishers
    • Educators
    • Individuals
    • Other Businesses
    • Speaking Engagements
  • Resources
    • Topic of the Week
    • Blog
    • Research
    • Academic Citations
    • Topic of the Week
    • Blog
    • Research
    • Academic Citations
  • Support
    • Donate
    • Shop
    • Donate
    • Shop
  • About
    • About Us
    • Our Team
    • Press
    • News
  • Media Bias Chart®
    • Interactive Media Bias Chart
    • Static Chart
    • Methodology
    • Source Pages
  • Products & Services
    • Advertisers
    • Publishers
    • Educators
    • Individuals
    • Other Businesses
    • Speaking Engagements
  • Resources
    • Topic of the Week
    • Blog
    • Research
    • Academic Citations
  • Support
    • Donate
    • Shop
Login
Upgrade
$0.00 0 Cart

Interactive Media Bias Chart®

App store badge
Google Play badge
Video Tutorial
Our Methodology
Upgrade Options
Member Access
App store badge
Google Play badge
Video Tutorial
Our Methodology
Upgrade Options
Member Access

Use search box to isolate the displayed sources (in bold) and see their individual articles or episodes

See More with Premium and Pro

Default display of premium chart
Premium IMBC for Members
IMBC EDU Pro for Education
Ad Fontes Data Platform

Want us to rate an article or episode?

Do you wonder about the legitimacy of a particular article you’re using for research? Did someone share an article or podcast with you, and you want to know if it’s legit? Submit a link to a recent article or podcast/TV episode below, and let our analyst team take a look!

This benefit is limited to ONE free article/episode per person. Want to submit more articles or episodes? Sign up for a News Nerd membership!

Submit an article or episode to be rated
Ad Fontes Media, Inc., is a public benefit corporation founded in 2018. The mission of Ad Fontes Media is to rate all the news to positively transform society.
Minority Business Enterprise certification from the National Minority Supplier Development Council
Certified LGBT Business Enterprise

Quick Links

  • Home
  • About Us
  • Contact Us
  • Become an Analyst
  • Speaking Engagements

Media Bias Chart

  • Interactive
  • Static
  • Methodology
  • Rated

Contact Us

  • info@adfontesmedia.com
  • education@adfontesmedia.com
  • +1 720-288-0412
Facebook-f Linkedin-in Layer Youtube X-twitter Pinterest
SUBSCRIBE
to our email list
Sign Up For Updates!

Copyright © 2025 Ad Fontes Media, Inc | All Rights Reserved

  • Terms of Use
  • Privacy Policy
  • Cookies

Media Bias Chart August 2025 flagship version

Want to make sure you always see the
latest versions of the Media Bias Chart?
Join the Ad Fontes Media email list!

You’ll get information about all of our work for
news consumers, educators and enterprises.


Email:


Scroll to top

Methodology Overview

Methodology Summary

The following description is a summary of our methodology. For more detail, please see our Methodology page.

Sources

Overall news source scores are generated based on scores of individual articles. Each article is rated by at least three human analysts with balanced political viewpoints: one who self-identifies as right-leaning, one as center-leaning, and one as left-leaning. Sometimes articles are rated by larger panels of analysts for various reasons.

For each news source, we pick a sample of articles that are most prominently featured on that source’s website over several news cycles. We typically have at least 15 articles rated per web source, but for larger sources (such as the New York Times and Washington Post) we have over 100 articles in our sample. We rate all types of articles, including those labeled analysis or opinion by the news source, and the dominant factor for how we select articles from a page is prominence.

Each overall source score is a weighted average of the individual article scores. Our weighting algorithm captures the effect that individual articles with low reliability or high bias have on overall perceptions of the news source.

Articles

Each analyst has gone through extensive training on Ad Fontes Media’s rating methodology, which is based on content analysis of articles.

Each analyst rates each article on three individual reliability sub-factors of 1) Expression, 2) Veracity, and 3) Headline/Graphic, and then the analyst gives the article an “Overall” reliability rating. Each of these ratings are on a numerical scale between 0-64, with 0 being the least reliable and 64 being the most reliable.

Each analyst also rates each article on three individual bias sub-factors of 1) Language, 2) Political Position, and 3) Comparison, and then the analyst gives the article an “Overall” bias rating. Each of these ratings are on a numerical scale between -42 (left) and +42 (right).

The analysts’ scores are then averaged, and the average score is shown on the chart.

Comscore Audience Reach Metric

Comscore’s Total Digital Population Data (provided by Comscore Media Metrix®, representing an unduplicated measure of digital audiences across desktop and mobile platforms) is viewable as a proportionally-sized bubble around each news/information source on the Media Bias Chart. Pro users who purchase the Comscore add-on can view and download numerical data as well.

We hope you enjoy exploring our data on the Media Bias Chart, and we’ll keep adding as much as we can to it as our company grows. If you want to help us grow and get access to the most updated downloads of the Media Bias Chart all the time, please consider becoming a member!

Summary of IMBC Tiers

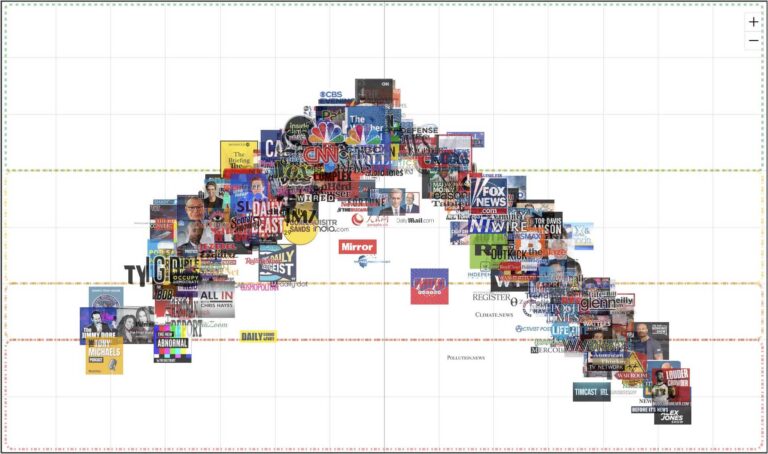
The Interactive Media Bias Chart® (“IMBC”) is a data visualization displaying both bias and reliability ratings for news and “news-like” content. Source types include Web/Print, Podcast, and TV/Video Programs. Our politically balanced team of human analysts allow us to continually add new rated sources and update current ones.

The IMBC is available as:
  • Free Public Edition
    • Contains 250 key sources for filtering or isolating.
    • Isolate up to 5 daily, 20 monthly, 50 yearly.
  • Premium Edition for Members or Classroom Premium for Educators
    • Contains 600 key sources for filtering or isolating.
    • Isolate up to 75 daily, 200 monthly, and 500 yearly.
    • Create and download customized charts.
    • Full additional member benefits for News Nerds
    • Media literacy lessons included with Classroom Premium
  • Pro Edition for Members or Campus Pro for Educators
    • All our fully rated sources across Web, Podcast, TV.
    • Unlimited sorting and searching.
    • Enhanced search features like ownership, source and article keywords
    • Media literacy lessons included with Campus Pro.
    • Download Custom Chart Images
    • IP-based authentication for whole-campus accounts.
  • Ad Fontes Data Platform with Commercial Use License
    • All our fully rated sources across Web, Podcast, TV.
    • Unlimited sorting and searching.
    • Download underlying data.
    • Commercial level access
    • Download customized charts.
    • API integration available as an add-on.

Please note: Comscore audience size data is only available as additional add-on for pro editions of the chart.