What’s the relationship between media ownership and bias?
Author:
Ad Fontes Media Staff
Date:
09/05/2023
In the news landscape, we sometimes hear people blame billionaires like Jeff Bezos (owner of the Washington Post) and Rupert Murdoch (owner of Fox Corporation) when they perceive unfair or biased news coverage in their respective publications or programs. But does ownership really make a difference in how media companies report the news?
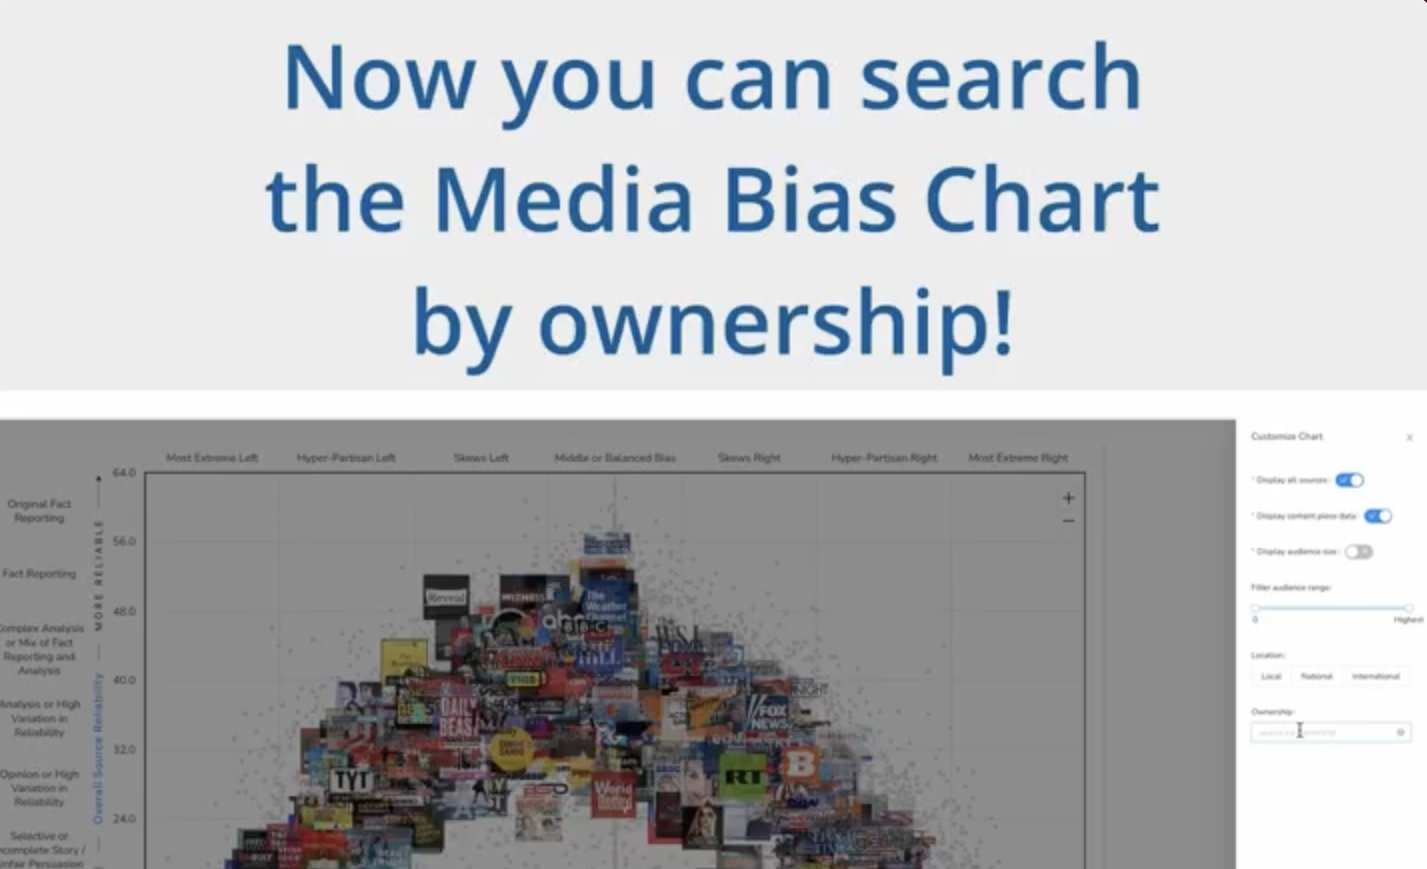
It’s a loaded question that’s not easy to answer. But it’s a relationship that can be explored with the new ownership data available in the Media Bias Chart®. Our research team has added more than 900 companies into our database; some own dozens of media properties and others only a few. Ownership data can be useful for all news consumers, but especially to advertisers considering where to spend their ad dollars, and our commercial customers can use the Interactive Media Bias Chart to filter sources by ownership.
Want to see how Gannett-owned newspapers rate in terms of bias? Are you curious if podcasts created by NPR are reliable and fact-based? You can find out by using our ownership filter! Here’s how.
Our analysts do not consider ownership when they rate sources using our methodology. Our research team works independently from the analyst team to research ownership of sources and add that information into our database.
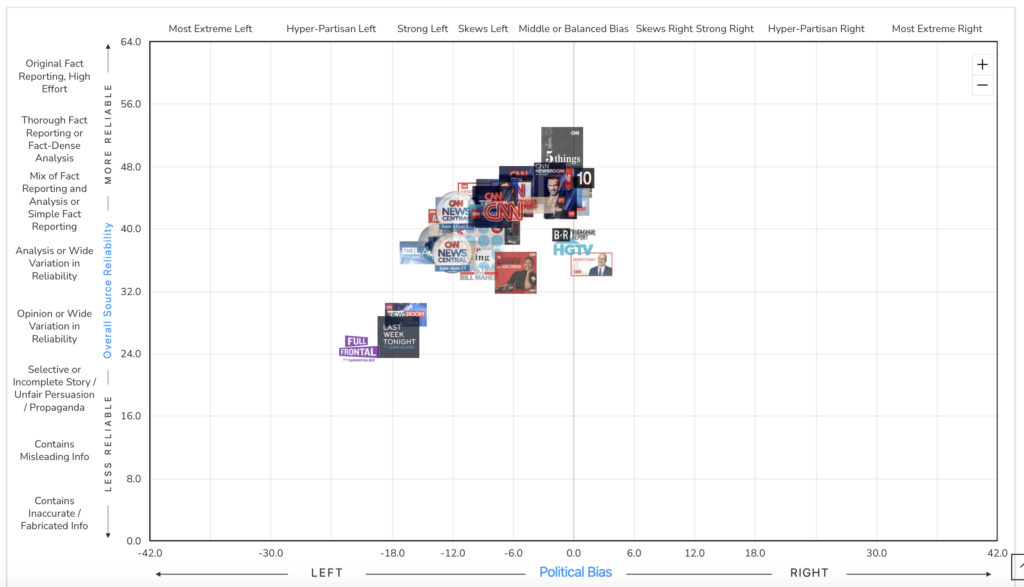
Searching our sources by ownership, however, does reveal some interesting patterns. For example, take a look at this chart displaying sources owned by Warner Brothers Discovery. That’s the parent company of CNN.
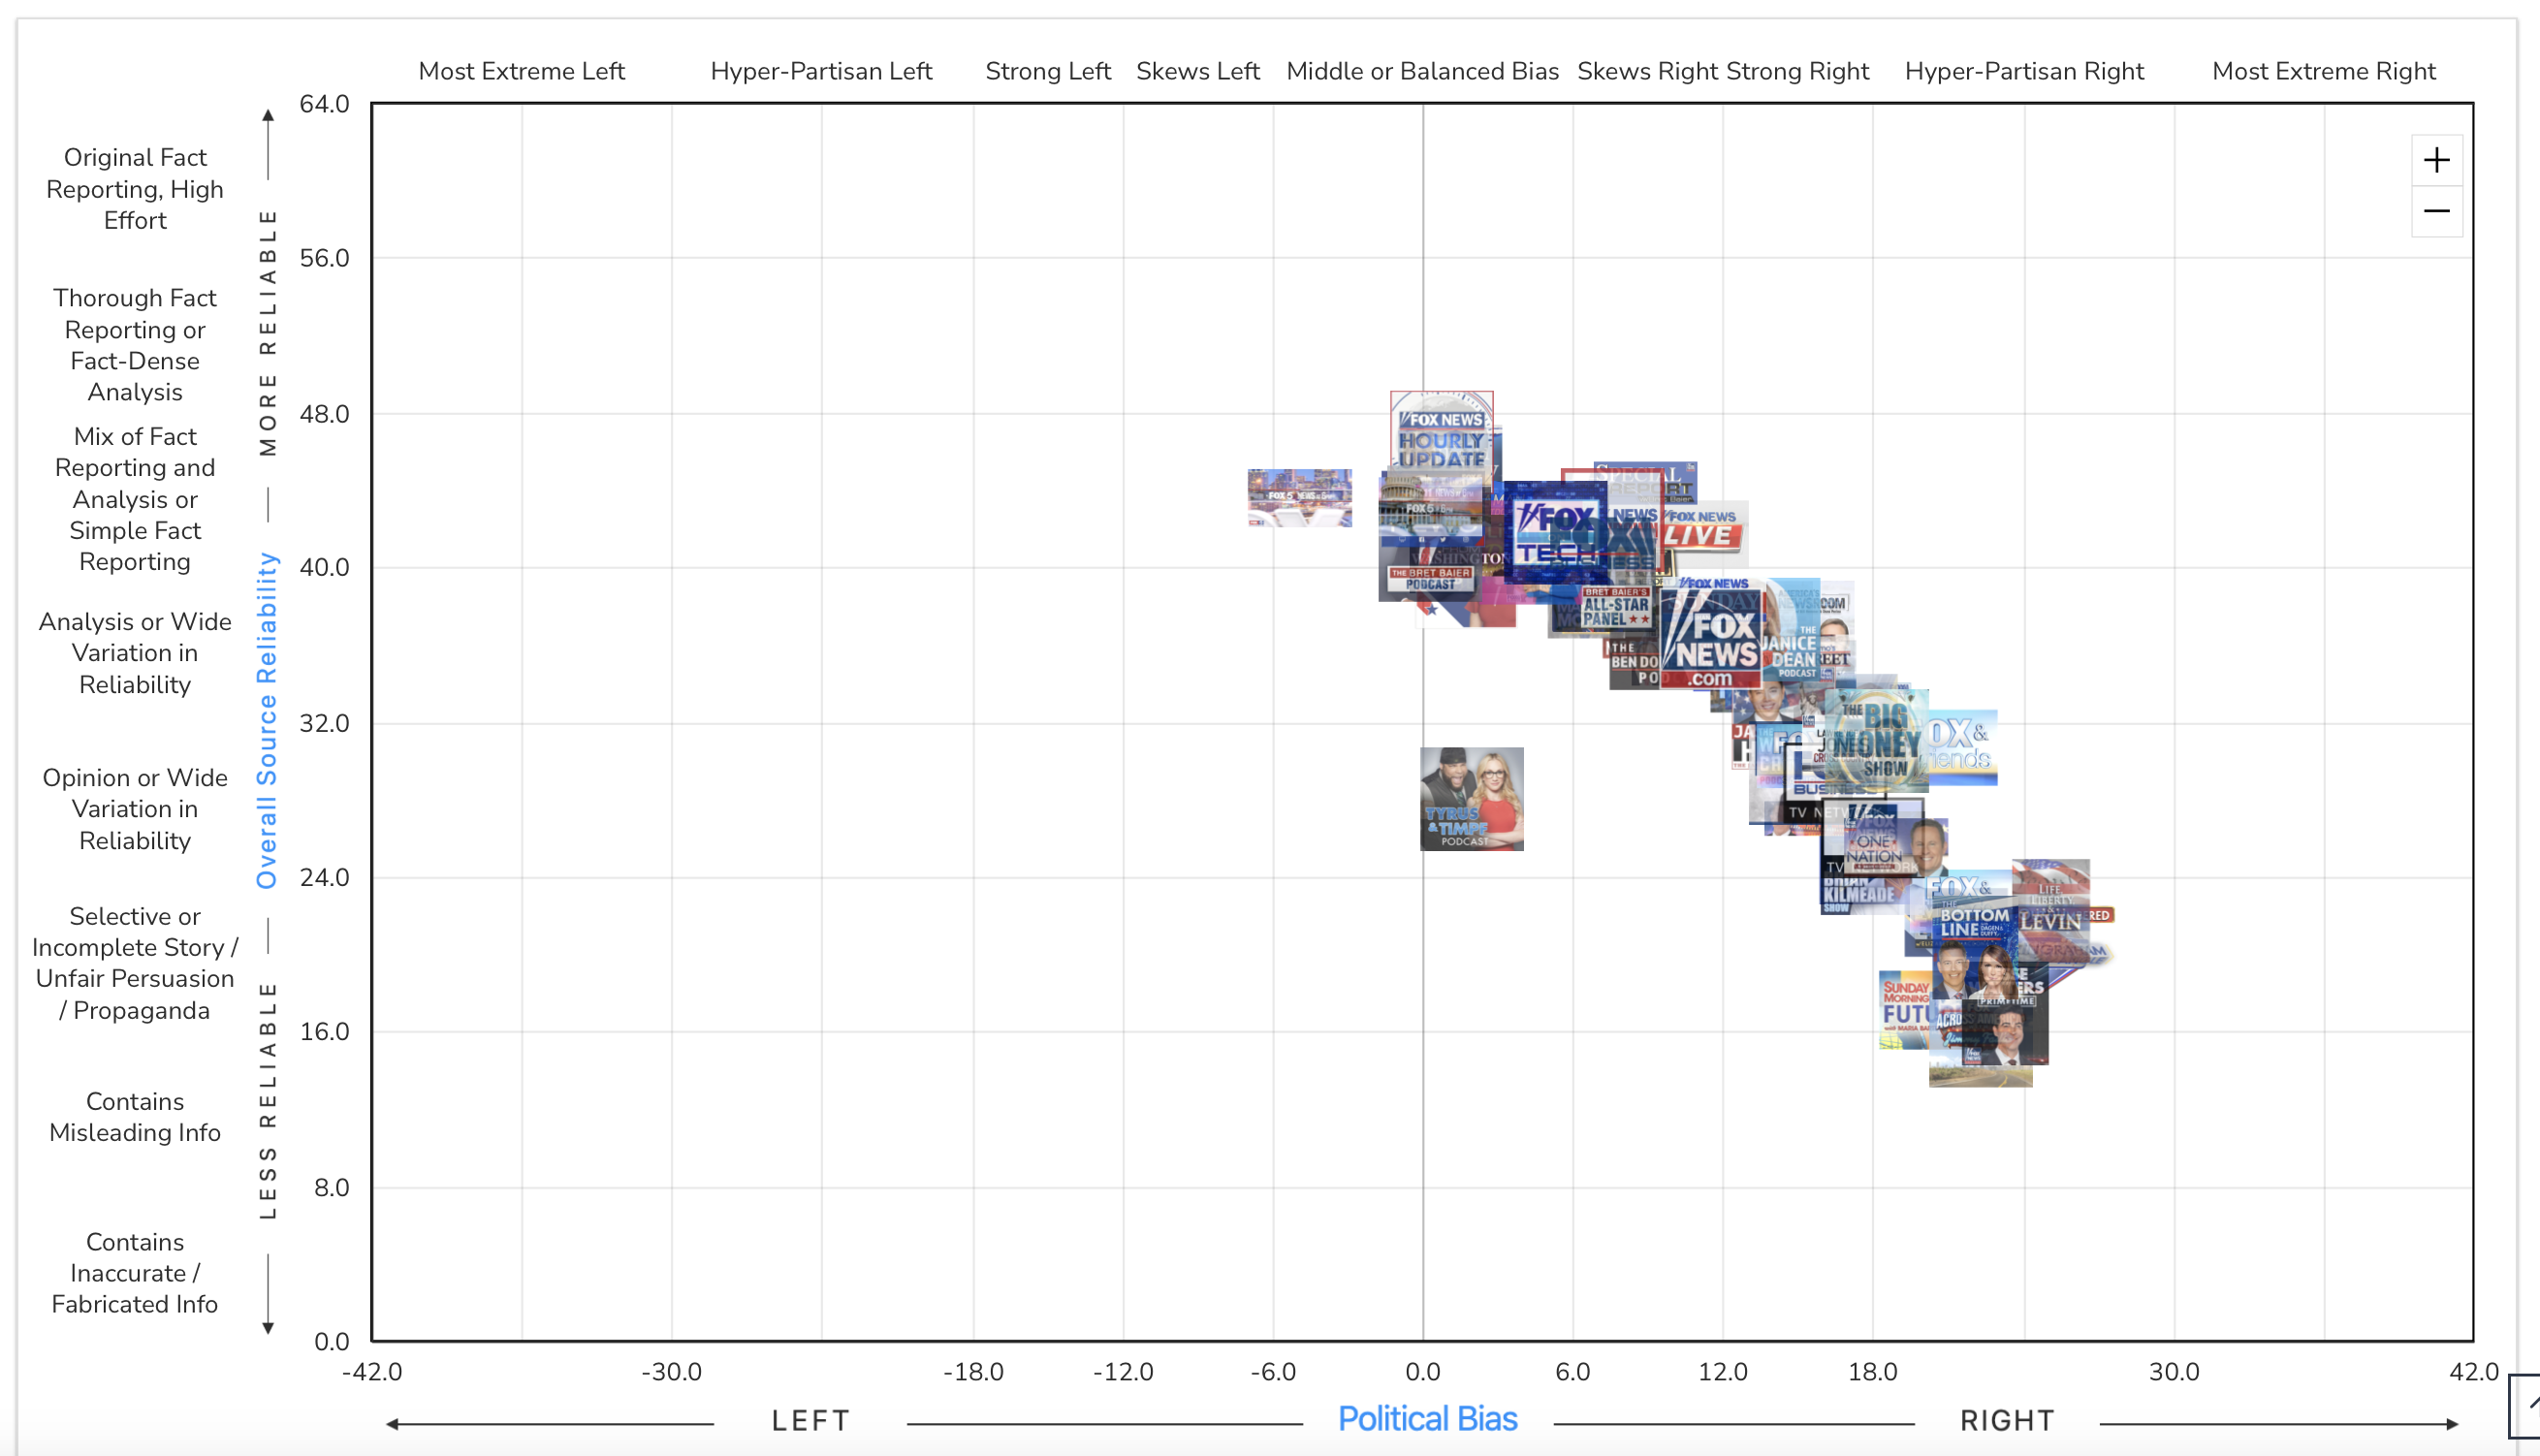
And here’s a chart showing sources owned by Fox Corporation, parent company of Fox News.
It’s impossible to know the day-to-day operations of various sources and whether or not the source’s ownership plays a role in determining what news is covered and how information is presented. However, these examples indicate a general connection between ownership and political bias. In terms of the reliability of sources, the impact of ownership is less clear.
Ownership is just one of the many data points available with an Ad Fontes Media subscription. Filters on the interactive chart also allow members access to geographic data, targeted audiences and much more.
If you’re interested in learning more, visit our website and schedule a demo. And to keep up with all of the work being done by our team, sign up for our free weekly email newsletter!


