Election Season Proves Relevance of Podcasts as an Information Source
Author:
Beth Heldebrandt
Date:
11/21/2024
The relevance of podcasts as a source of information was never more apparent than during this election season, when both Kamala Harris and Donald Trump were guests on popular podcasts during the weeks leading up to Election Day.
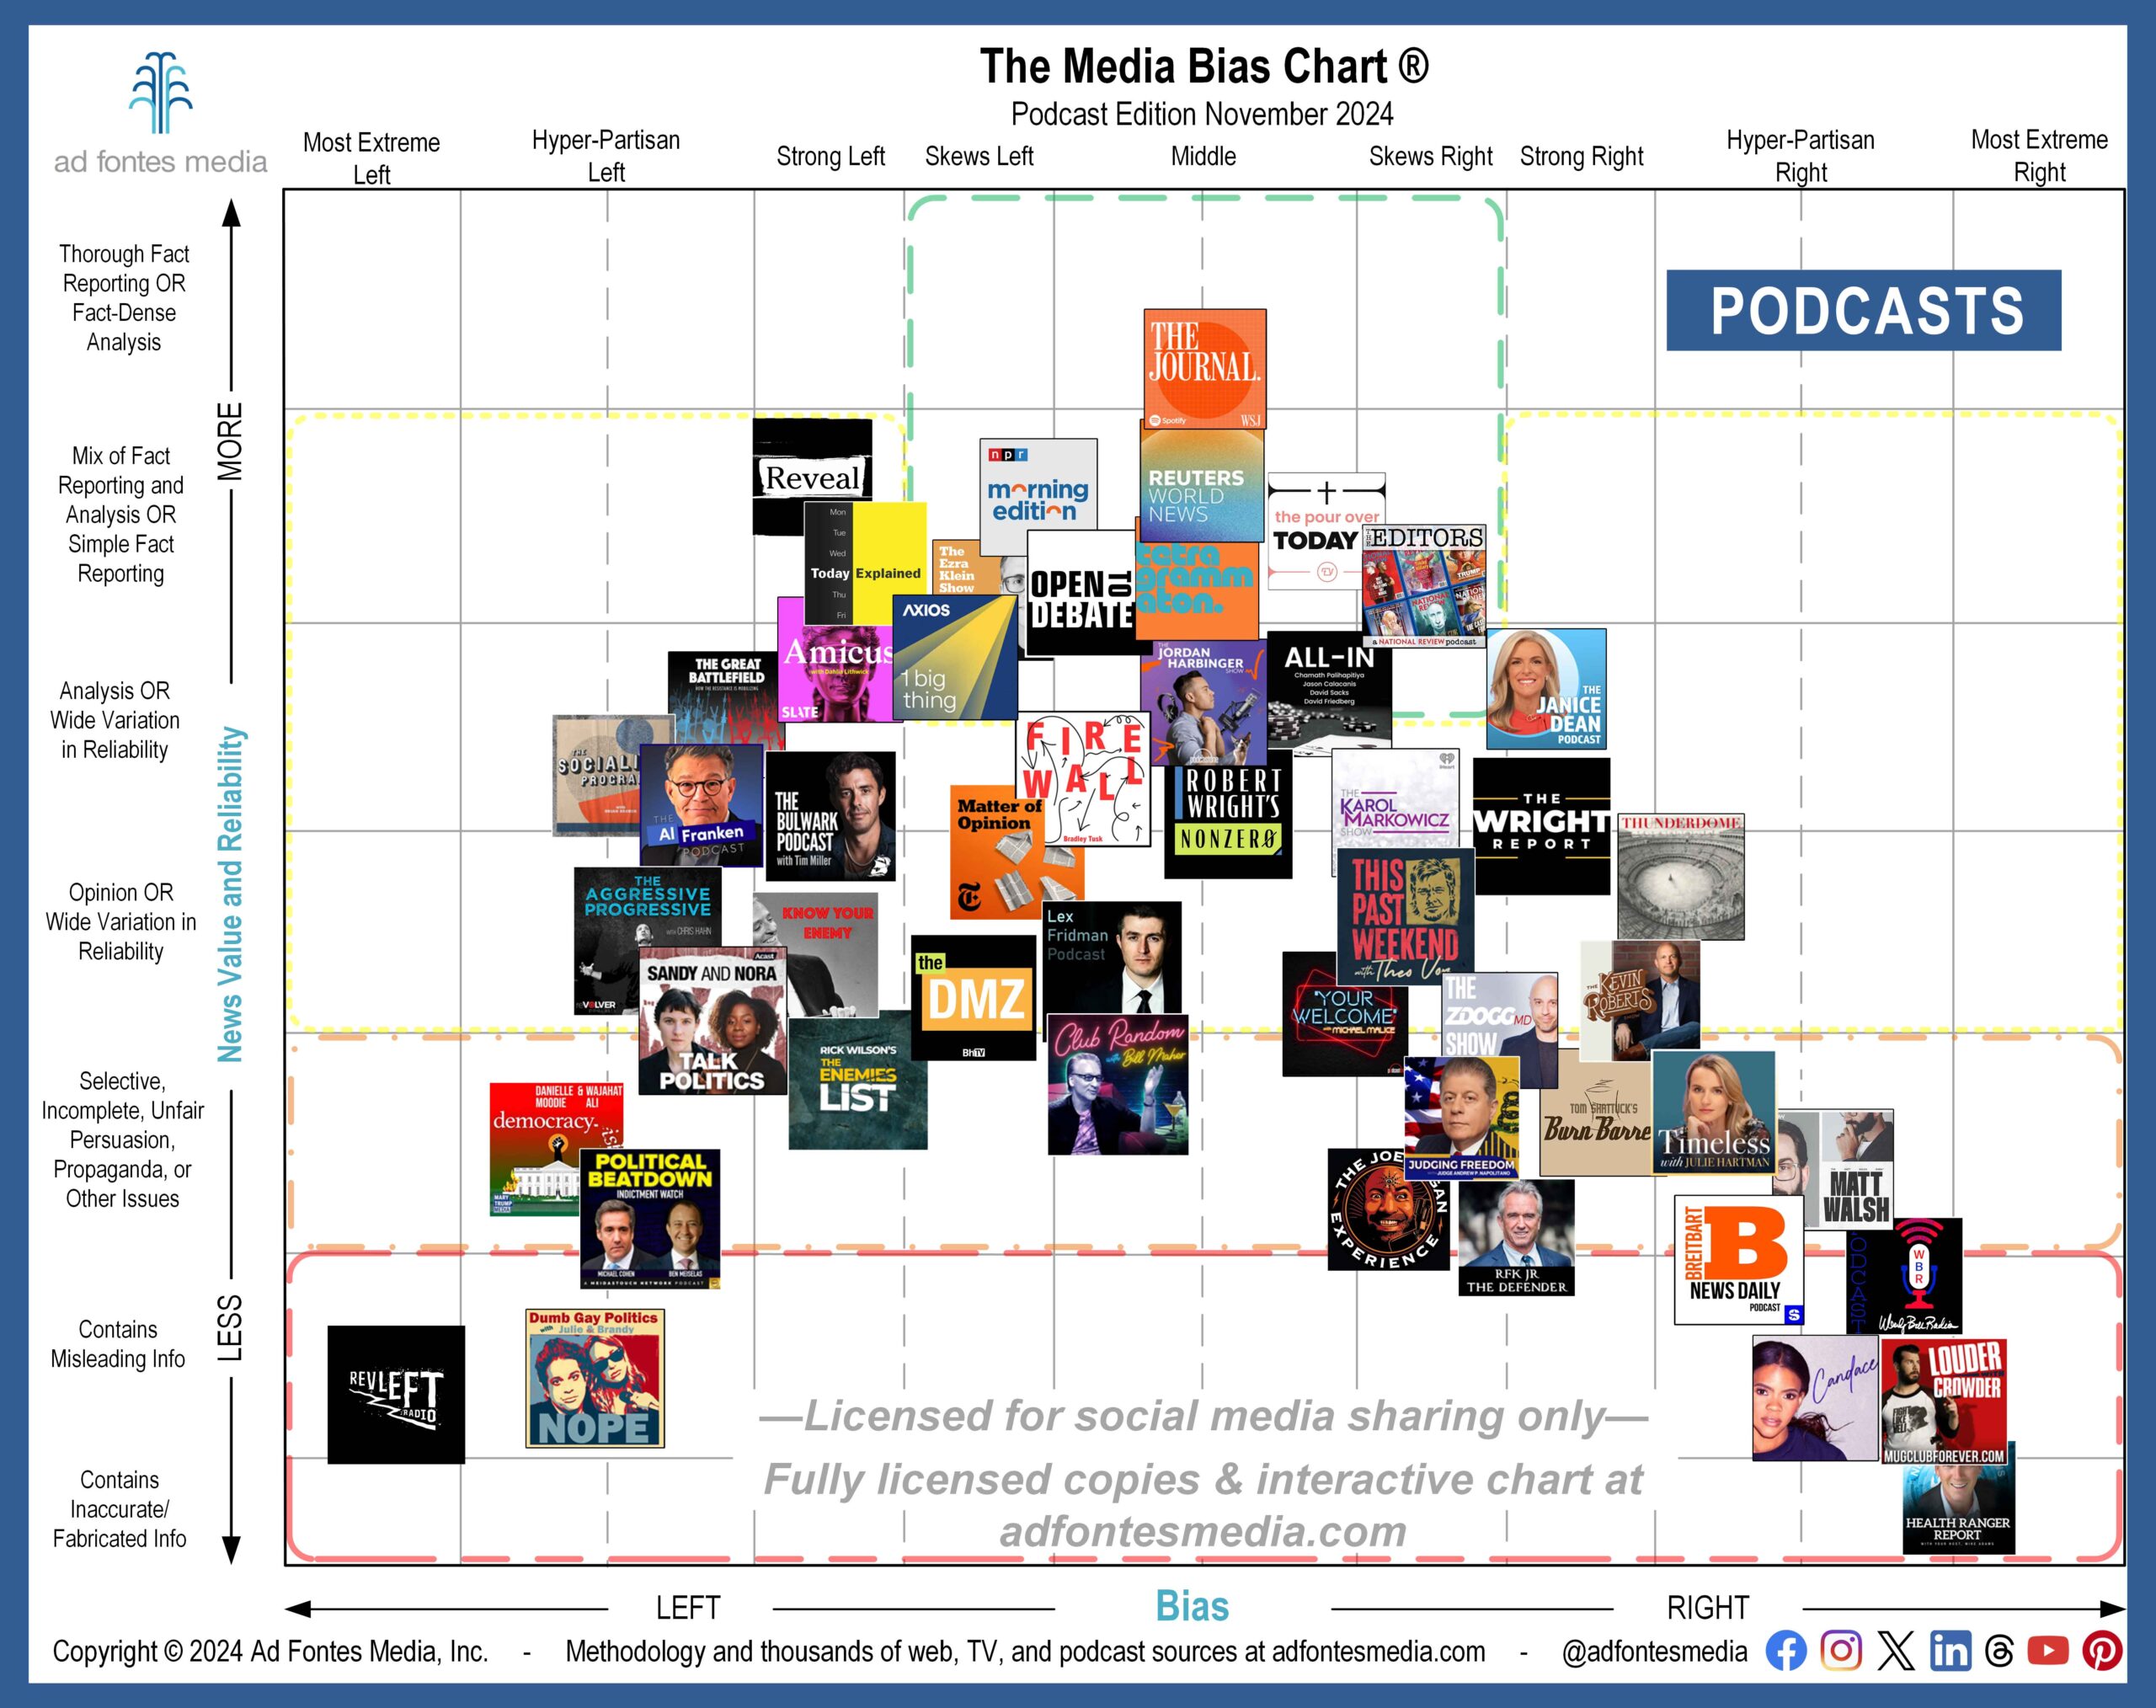
In fact, Trump’s appearance on The Joe Rogan Experience has been viewed more than 51 million times on YouTube, and that doesn’t count the audience who listened on Spotify, Apple or other platforms. Three of our analysts were among those who listened to the Rogan-Trump interview, and they rated it for bias (23, “hyper-partisan right”) and reliability (24.33, on the low end of the “opinion” section).
You can see Rogan’s show and 50 others on the November edition of the Podcast/Audio Media Bias Chart®. Our team has now rated more than 750 podcasts in all (that’s 2,800 episodes!), and 51 are featured on this month’s chart.
We choose a selection of podcasts to include on each month’s static media bias chart because it’s impossible to show all of them in one image (see the list of the 51 shows on the November chart here). In order to make the logos as large and readable as possible, we have magnified a portion of the chart and removed portions around the edges that contain no sources.
Six podcasts are included on the chart this month for the first time:
- Sandy and Nora Talk Politics
- Tetragrammaton with Rick Rubin
- The Breitbart News Daily Podcast
- The Bulwark Podcast
- The Karol Markowicz Show
- The Wright Report
If your favorite podcasts aren’t on the November chart, you can still search for them using the Interactive Media Bias Chart® on our website, as well as our Media Bias Chart® app, available for iPhone and Android. Daily search limits apply.
When you add in our web/print and TV/video ratings, our analysts have fully rated about 4,000 sources, with commercial data on over 11,100 sources. Become a subscriber today to have additional access to our data set!
Hint: Those on our email list can get 30% off an annual News Nerd subscription and Ad Fontes Media merchandise like T-shirts and mugs as part of our Black Friday Sale! Sign up for the email list here!


