What the ACRL Blog Critique Misses About the Media Bias Chart®
Author:
Vanessa Otero
Date:
04/14/2021
*I am the Founder and CEO of Ad Fontes Media and the original creator of the Media Bias Chart®. I wrote this response directly to the authors of an article entitled “Complex or Clickbait: The problematic Media Bias Chart,” which was posted on a popular blog for academic and research librarians called ACRLog (PDF of the original post or direct link).
The short version: On our chart, we’d rate the original article as “selective/incomplete; unfair persuasion” for reliability and “hyper-partisan left” for bias.
Here’s what I wrote back:
I read your blog that criticizes the Media Bias Chart and wanted to respond directly with some invitations and requests.
Please note that I very much respect and have an affinity for the community of academic and research librarians, not only because librarians are on the front lines of teaching information literacy, but also because the work my team and I have done on the Media Bias Chart and with Ad Fontes Media more broadly have been propelled by librarians who find it useful. We have had several librarians on our analyst team over the past two years. Currently, we have two librarians on our staff.
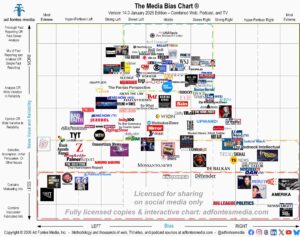
I wanted to respond to what appear to be your primary concerns: that the Media Bias Chart itself is 1) insufficiently nuanced because it is an image, and 2) incomplete, by itself, as a way to teach information literacy.
I actually agree with those points. Given that it is a shareable infographic, it necessarily condenses complex information about news sources. And it cannot replace necessary instruction on information literacy. But we do not claim that the image captures all the nuance about news sources, nor do we claim that it is a replacement for information literacy.
I personally, and my team at Ad Fontes, deeply care about nuance, data, detail, and transparency, and we provide it in ways you did not mention in your blog post. I invite you to explore our Interactive Media Bias Chart. Though you linked to it in the first line, you did not mention to your readers that it provides scatterplots of the dozens of articles we rate per source.
You cite a concern that “[a] media company is not a monolith…” and note that individual articles such as the NYT and WSJ op-eds were criticized by other authors in the organization. You also note that different publications have various sections and audiences. We know this and agree, and we believe our interactive chart illustrates this very concept you allude to.
We evaluate sources based on content analysis of many individual articles, not just a high-level source evaluation. Each dot on the interactive chart represents an article we have rated, and as you can see from the isolated view of the New York Times on our interactive chart, some articles are rated as opinion, others as analysis, and others as fact reporting. To date, our analyst team has rated over 12,000 individual articles and show episodes from news and news-like sources.
We also care deeply about media literacy–specifically, news literacy–and the importance of teaching people how to discern reliability and bias in news content themselves. That is why we provide a full news literacy education program, which teaches students how to rate articles using our methodology to create their own Media Bias Charts.
In your article you said “[a]s educators, we must transition away from crutches like these, and instead endorse comprehensive, skill-based evaluation of information sources.” Our program includes extensive instructor and student materials, over eight hours of instruction, and encourages practice to develop skill. I’d like to invite you both to review our curriculum and materials, free of charge. I believe you will find it comprehensively teaches skill-based evaluation of information sources. Please let me know if you would like to review it and I will have someone from my team set you up with access.
The Media Bias Chart is a tool that is especially useful for people who may never find their way to an academic librarian or a proper media literacy course for help. This population includes school-age students and those out of school who, for whatever reason, lack the time, inclination, or ability to sort through the news landscape. It reaches people who might not otherwise be reached. It helps them, and they express their gratitude to us in letters, emails, and social media posts, so I am not sorry that it exists in a shareable infographic form.
You state that I do not have an information literacy background, and you point to my prior professions in a way that implies I do not have the credibility required to contribute to the fields of media and news literacy. For some reason you selectively included that my former employer was the subject of a lawsuit and subsequent fine for securities fraud, which had absolutely nothing to do with me or my role as a salesperson for the company. This particular fact is irrelevant to my qualifications, but its inclusion in the article had the effect of implying that I am personally untrustworthy. I found it manifestly unfair.
You are entitled to believe that only those with advanced degrees in information literacy-related fields are qualified to teach anything that falls under the information literacy umbrella. However, the modern news and technology landscape has shifted greatly in the last twelve years, and as a result, there aren’t a lot of great resources for teaching how to navigate this modern news landscape. Educators have been looking for new, helpful tools, and many have appreciated my new contributions to this field.
As you note, I am a patent attorney. My undergrad degree is a B.A. in English from UCLA, and my J.D. is from the University of Denver. My formal education and professional career–13 years total– centered on analytical reading, writing, and reasoning, which was actually the perfect background for me to create a content analysis methodology for evaluating text. Walter Dean, a member of our Advisory Board and a journalism professor of over 40 years who co-authored one of the premier content analysis studies even done on news, helped us formulate our methodology.
I presented a webinar and blog series on how to teach news literacy for Infobase this past summer, which had 200-300 attendees at each session. I recently joined the Advisory Council for Media Literacy Now, a non-profit that works to legislate media literacy curriculum requirements in states. I presented a workshop at the Northeast Media Literacy Conference this past fall. These aspects of my background would be at least as important to include in a blog post about the Media Bias Chart as my other previous jobs.
There are a few other critiques that deserve rebuttal.
Regarding your critique that we “lionize” the political center, we do no such thing. There are two axes. The vertical axis is the one that measures reliability and news value. We state throughout our materials that we do not equate the middle of the chart with being the best. As we state on our “Intro to the Media Bias Chart” page:
“-What does it mean if a source is in the “middle” of the Chart?
The “middle” represents three distinct concepts. A source can be in the middle if it is either 1) minimally biased, 2) centrist, or 3) balanced. The “middle” isn’t necessarily the “best.” This Chart just tries to capture what the “middle” of US contemporary politics IS, without taking a position on what it “should be.”
For a full primer on the Media Bias Chart, see this 1-hour webinar recording by Ad Fontes Founder and CEO Vanessa Otero:
Intro to the Media Bias Chart: Definitions and Methodology”
I also reject the critique that our inclusion of conservative analysts makes our approach to rating political bias invalid. The blog post unfairly attributes support of Donald Trump’s statements and the attack on the Capitol to our analysts, which misses several logical and factual steps, and is inaccurate.
The way we have our analysts self-identify is by having them rate themselves on over 20 different policy positions. You can see that self-rating survey on our “Become an Analyst” application on our site. We find this results in a much more accurate classification of our analysts as left, right, and center than asking them who they voted for or which political party they are registered for, which is more binary. We currently have over 40 paid analysts.
Our work does not draw extremists. Our team includes staunch progressives and staunch conservatives, but even our most left-leaning and right-leaning analysts are committed to fighting misinformation and extremism, and each of them disdain the peddlers of such content from their own sides.
Therefore, just because one-third of our analysts are conservative does not mean they believe right-wing misinformation. Your post implies that they supported the Capitol Riots or believe the election was stolen. That is nonsense. All of our analysts are trained to evaluate claims for veracity using our methodology, and our right-leaning analysts rated claims of election fraud in the same manner our center and left-leaning analysts did—as false or misleading, as appropriate for the article, podcast or TV show.
Our analysts rate articles, podcasts, and TV shows together, live, on shifts in Zoom. Each shift has one left, one center, and one right analyst. They each read the article, rate it themselves, then look at each other’s scores, and discuss any differences. They rate the articles with remarkable consistency between themselves, despite their political differences.
The process of rating articles together is, itself, illuminating and inspiring. It shows that committed, thoughtful people of different political views can discuss facts, express their viewpoints, listen to each other, and come to agreements around two questions: how reliable and how biased is this piece of content? They can come to this agreement even if the underlying political issue is polarizing or emotional.
Your critique implies that we should not include conservatives because they are just “wrong” and therefore incapable of dispassionate analysis and truth-seeking. We believe the “we’re right, you’re wrong, so we’ll shut you out” approach to politics contributes to our country’s crisis of polarization. Therefore, our very process eschews the notion that only one side is right all the time and purposely includes people with different viewpoints. We are committed to diversity across many personal dimensions.
Our news literacy curriculum allows students to rate articles themselves. Many educators find that their left, right, and center students can engage around political articles just like our analysts do. Seeing students share healthy, thoughtful debate about the meaning of an article creates hope for our country’s future.
Once you have had a chance to review the Interactive Media Bias Chart and our Media Literacy materials, I request that you post an update or subsequent blog that notifies your readers that we do have these resources available and that they can evaluate my ability to teach news literacy for themselves by watching the free Infobase webinar series.
I invite you to do so because the last paragraph of your post implies that we do not recognize that “we must view each story within the greater media ecosystem.” We do, and our interactive chart shows that. Your post also implies that we are suggesting that information literacy be taught with only a meme. We do not suggest this, and the existence of our news literacy program contradicts such a claim. I believe a follow-up post would provide completeness and fairness to your blog readers.
About Vanessa
Vanessa Otero is the creator of the Media Bias Chart and the Founder and CEO of Ad Fontes Media.
She is a former patent attorney in the Denver, Colorado area with a B.A. in English from UCLA and a J.D. from the University of Denver. She is the original creator of the Media Bias Chart (October 2016), and founded Ad Fontes Media in February of 2018 to fulfill the need revealed by the popularity of the chart — the need for a map to help people navigate the complex media landscape, and for comprehensive content analysis of media sources themselves. Vanessa regularly speaks on the topic of media bias and polarization to a variety of audiences.


